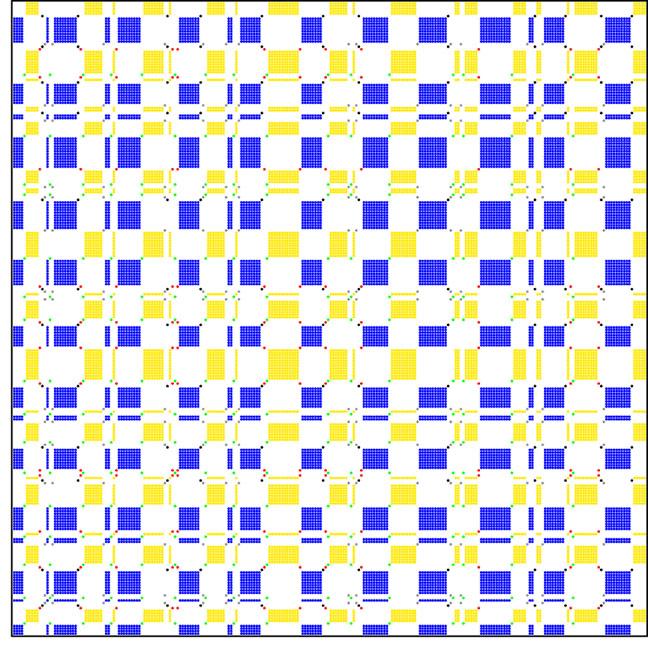
Mathematicians have successfully applied a new, pictorial approach to answer complex questions that puzzle analysts, such as, do media stories on firearm legislation influence gun sales? Cause-and-effect queries like this pop up in various fields, from finance to neuroscience, and objective methods are needed to deliver reliable answers.
Maurizio Porfiri, at the New York University, and Manuel Ruiz Marín, at Technical University of Cartagena, Spain, wrestled mathematical theory into quantifiable colorful maps called symbolic recurrence plots. In Chaos, from AIP Publishing, Porfiri’s team has proven the method’s validity.
“Pictures are very useful in understanding dynamical systems. They can help us identify the onset of patterns and whether one system influences another,” said Porfiri. “We bring forward an alternative approach based on recurrence, how often something repeats, creating colored plots where each specific color of the graph tells you the location of recurrence.”

Previous recurrence plots of dynamic systems were binary black and white, lacking the rich representation and robustness Porfiri has shown possible with his new colorful maps, which resemble the artwork of Piet Mondrian.
[ad_336]
Graduate students Alain Boldini and Mert Karakaya developed the code to examine recurrence in real datasets, starting with validating the technique on real data. They applied symbolic recurrence on three types of controlled experiments, where the causal links are well established, and the causalities matched in each case.
A consistent link was also confirmed between gun-legislation articles and firearm background checks. But the Mondrian-like plot enabled the team to go beyond previous analyses, identifying key features from the data, e.g., mass shootings that impacted the firearm ecosystem.
Finally, the team moved into unknown territory, analyzing recurrence in a dataset for which no evidence of a relationship existed. They examined how social interactions in zebrafish, an important animal for preclinical models of behavior and disease, were influenced by the sex of the animals.
“It was exciting to apply this technique to a new question and discover that males have a strong influence on the behavior of females,” said Porfiri, who is making the software freely available so that other researchers can apply symbolic recurrence quantification to their own dynamical system riddles.
[rand_post]
Unsatisfied with the current format of the plots, he’s eager to apply network theory to produce easily translatable graphs. Having mastered interactions between pairs of data, like two fish, Porfiri wants to examine multiple systems, which means more fish. However, he anticipates that removing confounding factors and ensuring a meaningful but functional analysis will be quite the challenge.